Why Urban Heat Island Research Needs to Look South — Lessons from Pokhara
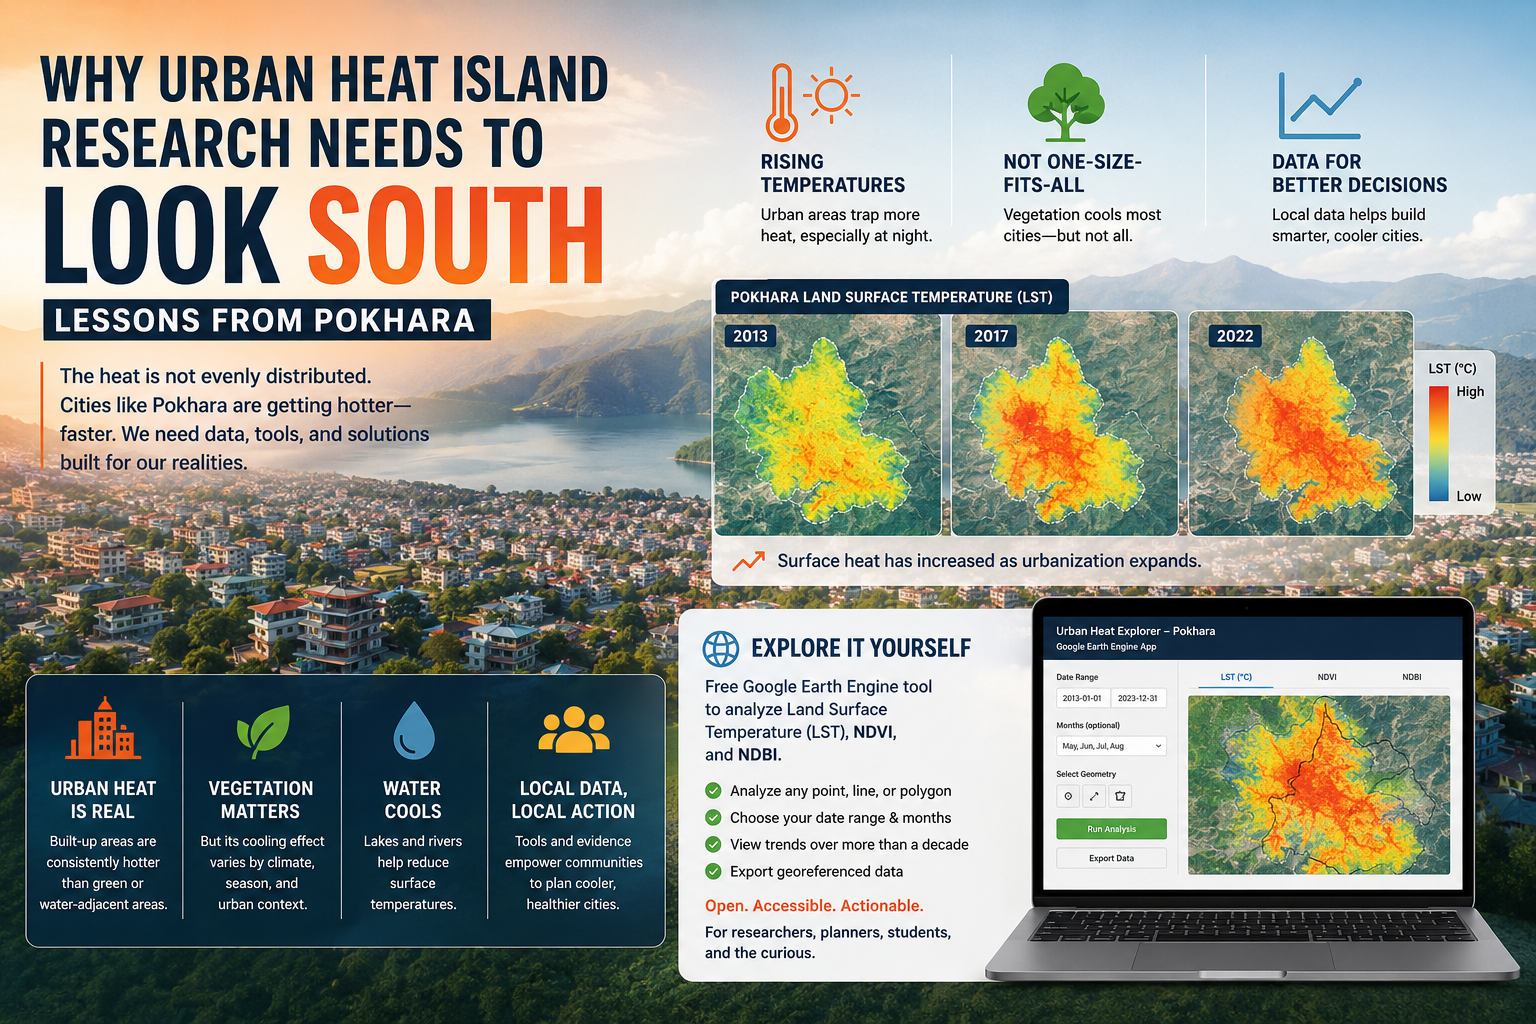
Open almost any major study on urban heat islands and you'll find the same kind of city behind the data: temperate, well-instrumented, and usually somewhere in North America or Europe. That's not an accident — those are the cities with the weather stations, the funding, and the decades of records that make this kind of research easier to do.
But it's a gap. And it's a gap that matters most in exactly the places least equipped to close it.
The heat is not evenly distributed
Urban heat islands form because concrete, asphalt, and dense construction absorb heat during the day and release it slowly at night, keeping cities warmer than the countryside around them long after the sun goes down. That effect isn't new. What's changed is the scale of the consequences.
A World Weather Attribution analysis of the June 2026 heatwave across Western Europe found that human-driven climate change made the extreme daytime temperatures more than ten times more likely, and the unusually hot nights roughly a hundred times more likely, than they would have been a few decades ago. Early estimates put the death toll from that single heatwave in the tens of thousands.
Now consider a different kind of city: hot and humid year-round, rapidly urbanizing, without the cooling infrastructure of wealthier regions — and heading into a strong El Niño for 2026–2027 that's expected to intensify heat exposure further. Recent reporting on tropical cities has made a point that doesn't get said often enough: the solutions to urban heat exist, but many of the cities that need them most can't afford to implement them.
Pokhara, and cities like it across South Asia, fall squarely into that second category. And that's exactly why they need to be studied on their own terms, not as an afterthought to research designed around a different climate entirely.
Why "just plant more trees" isn't universal advice
One of the more counterintuitive findings to come out of 2026 research is that vegetation doesn't cool every city equally. A global study published in Science Advances this year found that in very dry, arid urban environments, vegetation can actually increase surface temperatures rather than reduce them — the opposite of the effect it has in most other climates.
That matters for monsoon-driven cities like Pokhara, where the relationship between vegetation, humidity, and surface temperature plays out very differently across the year. A dry-season NDVI reading and a monsoon-season NDVI reading aren't telling you the same story about cooling potential — which is part of why seasonal analysis, not just annual averages, matters so much here.
What this looks like on the ground in Pokhara
My own research analyzed land surface temperature across Pokhara Metropolitan City using over a decade of Landsat imagery, tracking how surface heat has shifted as the city has urbanized. The pattern is consistent with what's showing up globally: built-up areas run measurably hotter than vegetated or water-adjacent areas, and that gap has been widening.
What's harder to find in the broader literature is how to keep watching that pattern change — especially for smaller or mid-sized cities that will never get the dedicated monitoring infrastructure that a handful of major metros do. That's the gap I built a tool to fill.
Explore it yourself
I built a free, interactive tool on Google Earth Engine that lets anyone — researchers, planners, students, or just the curious — check land surface temperature, vegetation (NDVI), and built-up intensity (NDBI) for any point, line, or polygon they choose, going back over a decade.
You can pick your own date range, restrict the analysis to specific months (useful for isolating pre-monsoon heat from monsoon-season readings), and export the results as real georeferenced data.
Try the interactive LST + Index Area Analysis Tool — click a point, draw a line or polygon, or load your own shapefile, and see the data render live.
Launch the tool →Cities like Pokhara don't need to wait for someone else to study them. The satellite data already exists — what's been missing is easy access to it.
Further reading
- Guo, Z. et al. (2026). Global urban vegetation exhibits divergent thermal effects: From cooling to warming as aridity increases. Science Advances. doi.org/10.1126/sciadv.aea9165
- World Weather Attribution / UN University (2026). What Are Urban Heat Islands and Why Do They Matter? unu.edu
- Litchkofski, A. (2026). Urban heat islands have solutions; many tropical cities can't afford them. Mongabay. news.mongabay.com
- Jamarkattel, U. (2025). Analyzing Urban Heat Islands in Pokhara Metropolitan City-Nepal Through Remote Sensing Techniques. Remote Sensing Applications: Society and Environment. doi.org/10.1016/j.rsase.2025.101479